The pipeline, the exits, and exactly what talks to Alpaca.
This is the technical layer under the home page's summary — the actual filter logic, the exit state machine, and every API call the trading job makes, with nothing abstracted away.
Reading a Form 4 correctly
SEC filings are public but not always clean. Building this pipeline surfaced real data-quality issues worth being upfront about: some filers encode boolean fields like isDirector as "1", others as the literal string "true" — a scanner that only checks for "1" silently drops every filer using the other convention. Joint filings (common for SPACs) list the same accession number under multiple CIKs, so a naive scanner double- or triple-counts the same real-world transaction. The issuer CIK in SEC's daily index file isn't always the actual issuer — it can be a reporting owner's own CIK instead, which breaks any lookup that assumes otherwise.
None of this is exotic. It's just the ordinary cost of parsing real government data instead of a clean API, and it's the reason a naive version of this scanner can report zero results on a day that actually had genuine signal.
The four filters, precisely
- Transaction code = P, exactly. Not A (grants), M (option exercises), S (sales), F (tax withholding), or G (gifts). Code P is the SEC's own designation for an open-market purchase.
- Filer is an officer or director, purchase ≥ $100,000. Computed as shares × price per share from the filing itself, not an estimate.
- Not part of a 10b5-1 plan. Checked via the filing's own
aff10b5Onefield. - $1B+ market cap, 500K+ average daily volume, S&P 500 or NASDAQ-listed. Market cap is computed from SEC XBRL shares-outstanding data (the issuer's own most recent 10-Q/10-K filing) multiplied by the latest traded price from Alpaca's market data API. Average volume is the trailing 21 trading days.
Sizing and exits
Every qualifying signal is sized at 2% of current account equity, capped at 15 simultaneously open positions, and never added to a ticker already held. On entry, a plain stop-sell order is placed at 15% below the fill price.
The exit logic isn't a single order type, because no broker order natively expresses "flat stop, then switch to trailing once profitable enough." It's a small state machine, re-evaluated daily:
- Below +15% gain: the original 15% stop-loss stands, unchanged.
- At or above +15% gain: switch to trailing mode. The stop becomes 10% below the position's high-water mark, and that floor only ever moves up — a pullback never lowers it.
- 90 days after entry, if the position is still within ±3% of its entry price (effectively flat), it closes regardless of the stop levels above.
Does the signal actually work? A backtest
The filter definition above isn't just a hypothesis. It was tested against SEC's official historical bulk Form 3/4/5 dataset — the same officer/director, code-P, non-10b5-1, $100K+ definition, reconstructed for every qualifying signal from 2023 Q3 through 2025 Q2 (4,014 signals after collapsing duplicate line items down to one per ticker per filing day). Forward returns were measured against SPY from the first trading day on or after the filing date — not the transaction date — since that's the earliest point a real-time scanner could actually have acted.
| Horizon | Mean excess return | Median excess return | Hit rate | Out-of-sample significance |
|---|---|---|---|---|
| 5 trading days | +2.38% | +0.92% | 57.1% | p < 0.0001 (both tests agree) |
| 30 trading days | +0.90% | −1.58% | 44.6% | Tests disagree — see below |
| 90 trading days | +0.80% | −4.53% | 40.8% | Tests disagree — see below |
Table shown reflects the last completed run; see the note below for how it's kept current.
The most recent 30% of signals by filing date (from 2024-12-18 on) were held out and never used while defining the filter above — the 5-day result replicates on that untouched data (+2.54% mean, 58.8% hit rate, p < 0.0001), which is the strongest evidence this isn't curve-fit.
The 30- and 90-day rows need a caveat the mean alone hides. A standard t-test on those two horizons comes back not significant out-of-sample (p = 0.70 and p = 0.87) — that reads as "the edge fades and disappears." But a distribution-free test on the median (Wilcoxon signed-rank) stays highly significant at every horizon past 5 days (p < 0.0001), and since the median itself is negative, that significance runs the other way: the typical signal is significantly behind SPY by 90 days, even though a handful of large winners keep dragging the mean back up to a small positive number. A test built on the mean misses this; a test built on ranks doesn't.
Practical reading: the data supports treating this as a short-horizon (roughly one-week) drift signal, not a long-term stock pick — consistent with "a genuine, non-scheduled purchase carries real information" rather than "insiders are always right." This backtest measures the entry signal in isolation against fixed horizons; it is not a backtest of the live system's actual exit logic (trailing stop, 90-day flat-timeout) above, so it will not exactly match the paper account's realized returns. Full methodology, limitations, and raw signal-level data: the backtest write-up on GitHub.
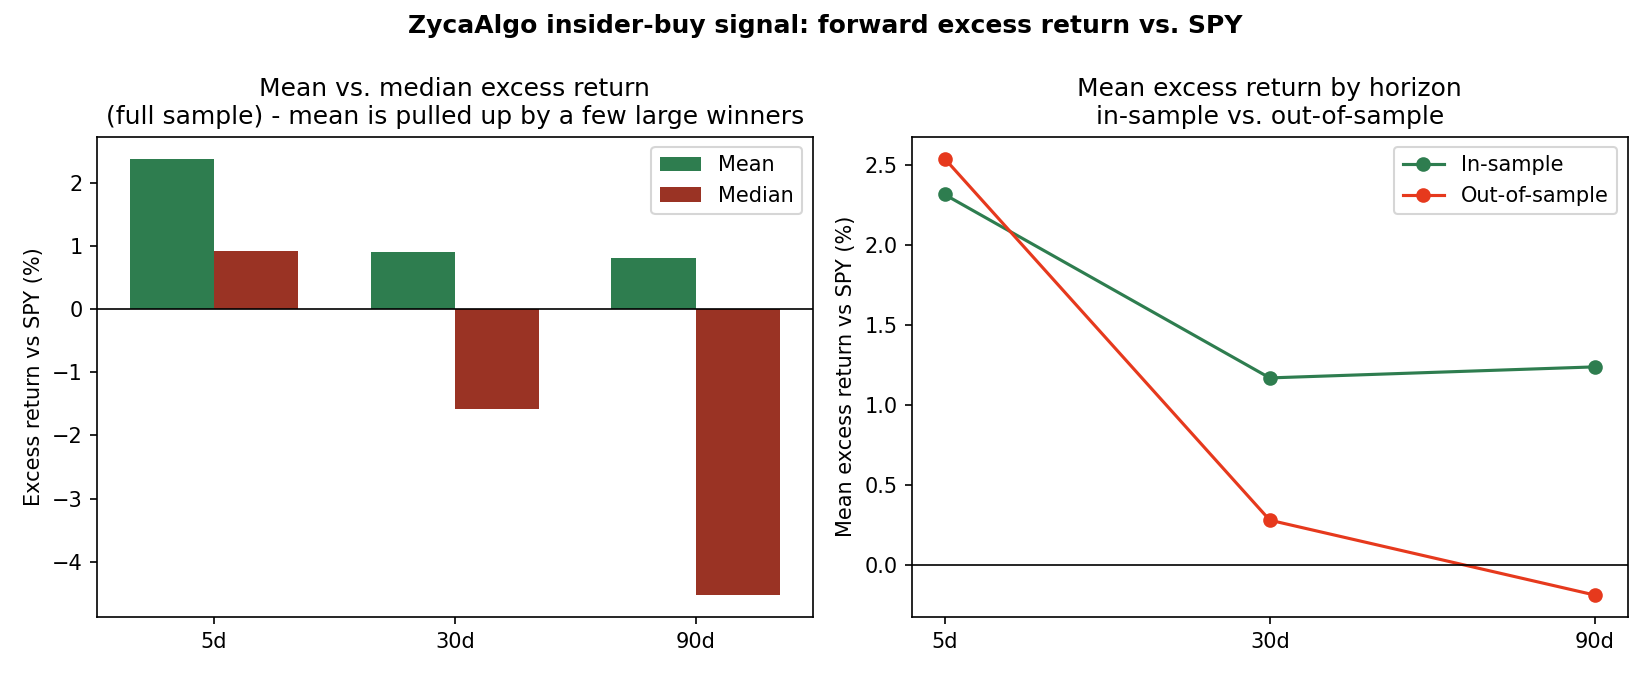
The table and chart above rerun automatically on the 1st of each month against whatever quarter SEC has most recently published, so the numbers stay current rather than describing a one-time snapshot. The specific figures cited in the paragraphs above (the +2.38% five-day result, the 30/90-day reversal) reflect the run as of this page's last edit — they'll drift slightly from the live table as new data comes in, though the qualitative finding (short-horizon drift, longer-horizon reversal caught only by the rank-based test) is not expected to flip from one month of additional data. Check the table itself, not this paragraph, for the exact current numbers.
What we tested and threw away
A strategy becomes a black box one plausible-sounding rule at a time. So every filter above was also tested against this project's own data, and the ones that failed were dropped rather than quietly kept.
The obvious candidate was a technical confirmation filter — only take the insider buy if the chart also looks healthy. It was measured across 2,977 backtested signals, with every indicator computed from bars dated strictly before the filing date, so nothing could use information the system wouldn't have had at the time.
| Condition | Result |
|---|---|
| Price above its 200-day average | Selects the worse half at short horizons |
| Price above its 50-day average | One significant horizon — which flips sign out-of-sample |
| RSI(14) below 70 | No measurable effect |
| Volume above its 20-day average | No measurable effect |
| Within 25% of the 52-week high | Substantially worse at every horizon |
Every confirmation filter would have made results worse or made no difference at all. The one robust effect runs opposite to the intuition: insider buys in stocks near their 52-week high underperformed beaten-down names by 2 to 9 percentage points, and unlike the others it held on both sides of the in-sample cutoff — −2.35, −2.43 and −3.77 points in-sample, and −2.99, −2.97 and −8.97 points out-of-sample.
That is explicable rather than accidental. Insiders are, in aggregate, contrarian buyers (Lakonishok & Lee, 2001). Confirming a contrarian signal with trend-following filters fights the mechanism the signal depends on — it throws away precisely the beaten-down names where an insider's conviction carries the most information.
It was not adopted. This account has run one methodology since it opened, and changing the rules midway would turn its public track record into a blend of two strategies that demonstrates neither. Both sides of the out-of-sample split also sit inside the same broadly rising market, so "beaten-down names recover" remains a plausible regime effect rather than a law. Testing it honestly means running a second paper account in parallel, not editing this one. Full study, including the conditions that failed: the technical filter report on GitHub.
What runs, and when
fetch SEC daily index .......... ok
parse Form 4 filings ........... ok
apply filters, dedupe .......... ok
write data/latest.json
$ python scripts/trade_manager.py manage
check open positions for exits
place/replace stop orders
$ python scripts/trade_manager.py enter data/latest.json
liquidity filter, sizing, entries
log to trades.md + trades.json
This sequence runs on GitHub Actions Tuesday–Saturday at 15:00 Bangkok time (08:00 UTC), on GitHub's servers — not on anyone's laptop, so it fires whether or not a machine happens to be on. It's shifted a day off the trading week on purpose: SEC's daily filing index for a given trading day isn't published until after their 10pm ET same-day filing cutoff, so it's only actually ready the following UTC morning — a Tuesday run is what picks up Monday's filings. Every run commits its own output back to the repository, so any position can be traced to the exact filing and commit that produced it.
GitHub's own cron scheduling for this workflow turned out to be unreliable in practice — scheduled runs were observed firing hours off-target or not firing at all. Rather than just hope it fires, an independent process now calls GitHub's workflow-dispatch API on the same Tuesday–Saturday 08:00 UTC schedule as a redundant trigger, so the job's actual reliability doesn't depend on GitHub's scheduler alone.
The Alpaca connection
The trading job authenticates to Alpaca with a key/secret pair stored as encrypted secrets (GitHub Actions secrets for the scheduled job, Vercel environment variables for this website's live dashboard). Neither is ever written to a file in the repository or exposed to the browser.
| Endpoint | What it's used for |
|---|---|
/v2/account | Equity, cash, and buying power — used for position sizing and the dashboard's live stats. |
/v2/positions | Currently open positions and unrealized P/L. |
/v2/orders | Placing entry and stop-loss orders, and checking whether an entry has filled yet. |
/v2/account/portfolio/history | The equity curve drawn on the home page. |
/v2/stocks/bars, /v2/stocks/trades/latest | Price and volume data for the liquidity filter. |
Safety guarantee
The trading script's base URL is hard-coded to https://paper-api.alpaca.markets — Alpaca's simulated-money endpoint. There is no live-trading endpoint anywhere in this codebase, and no configuration flag that switches it. Turning this into real-money trading would require someone to deliberately rewrite that constant and redeploy — it cannot happen by accident, by a bad setting, or by a bug in the filter logic.